
Why a data-first view matters
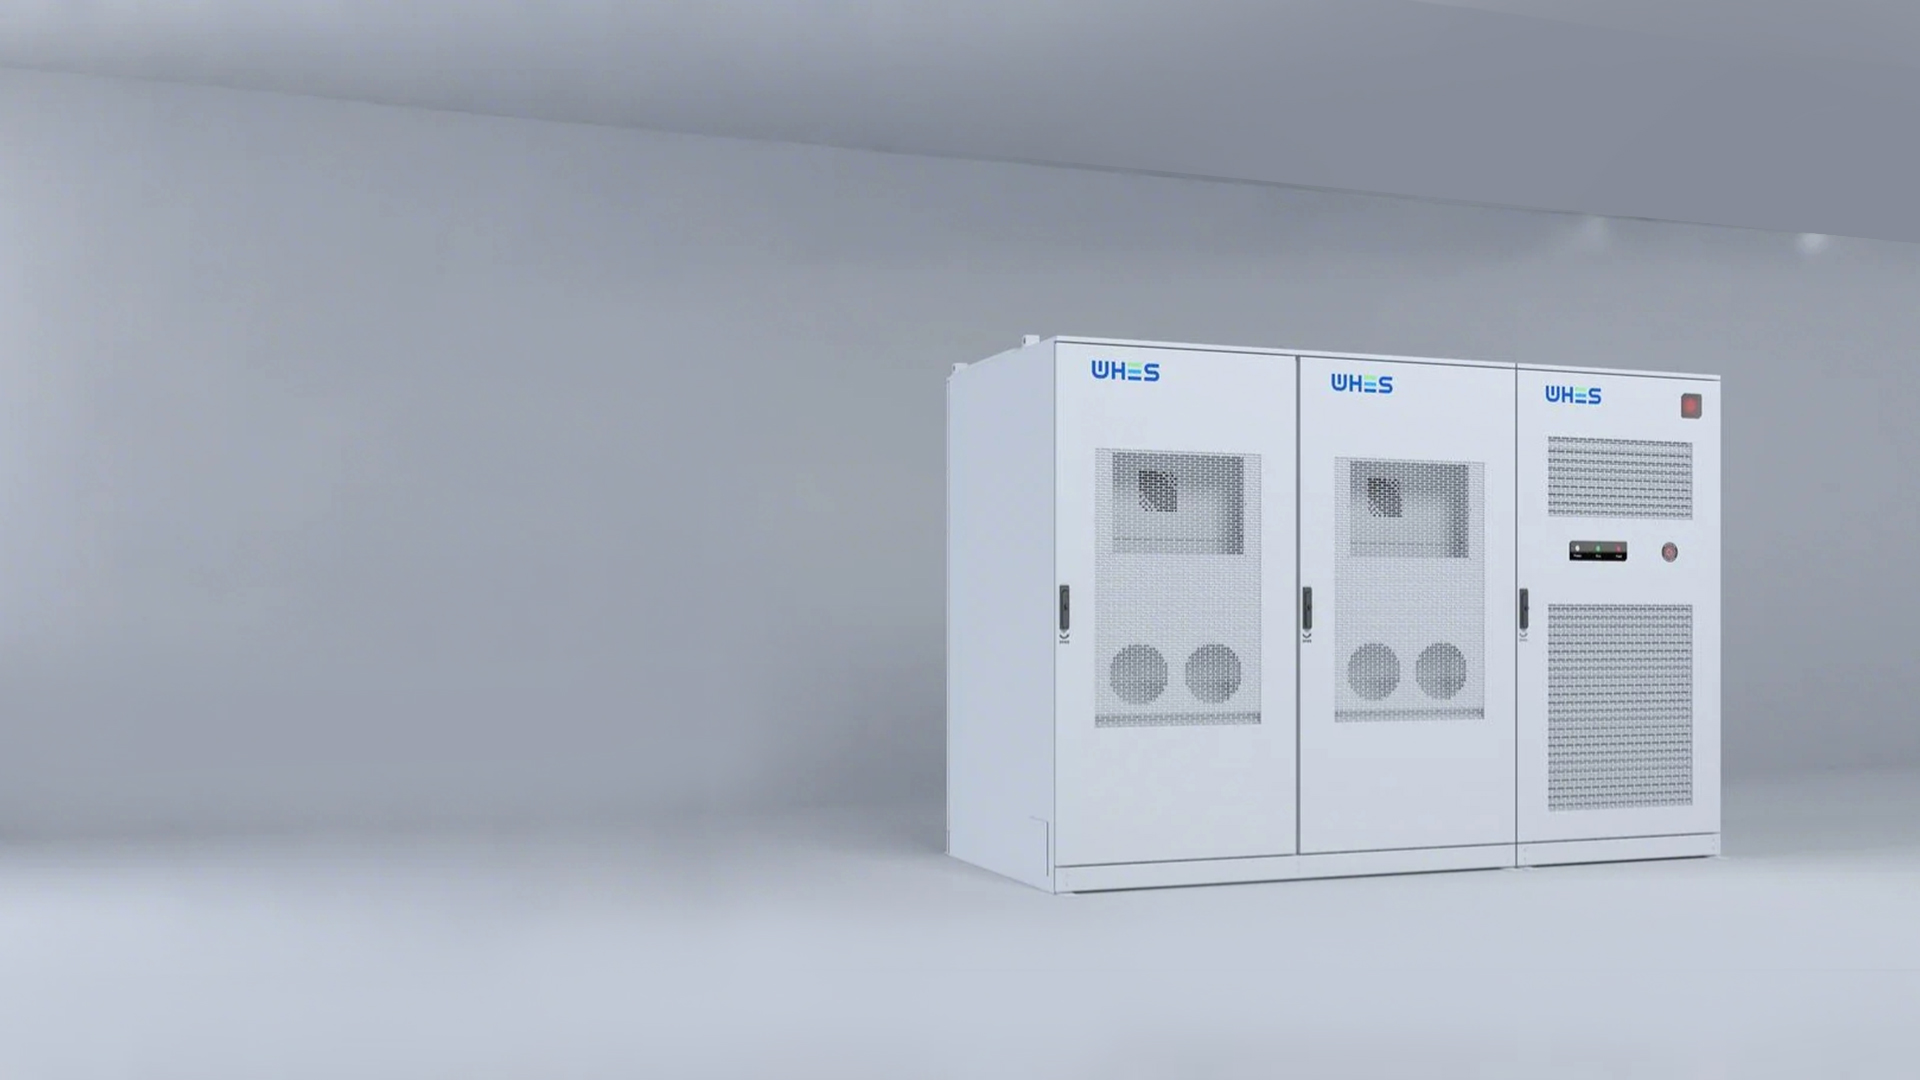
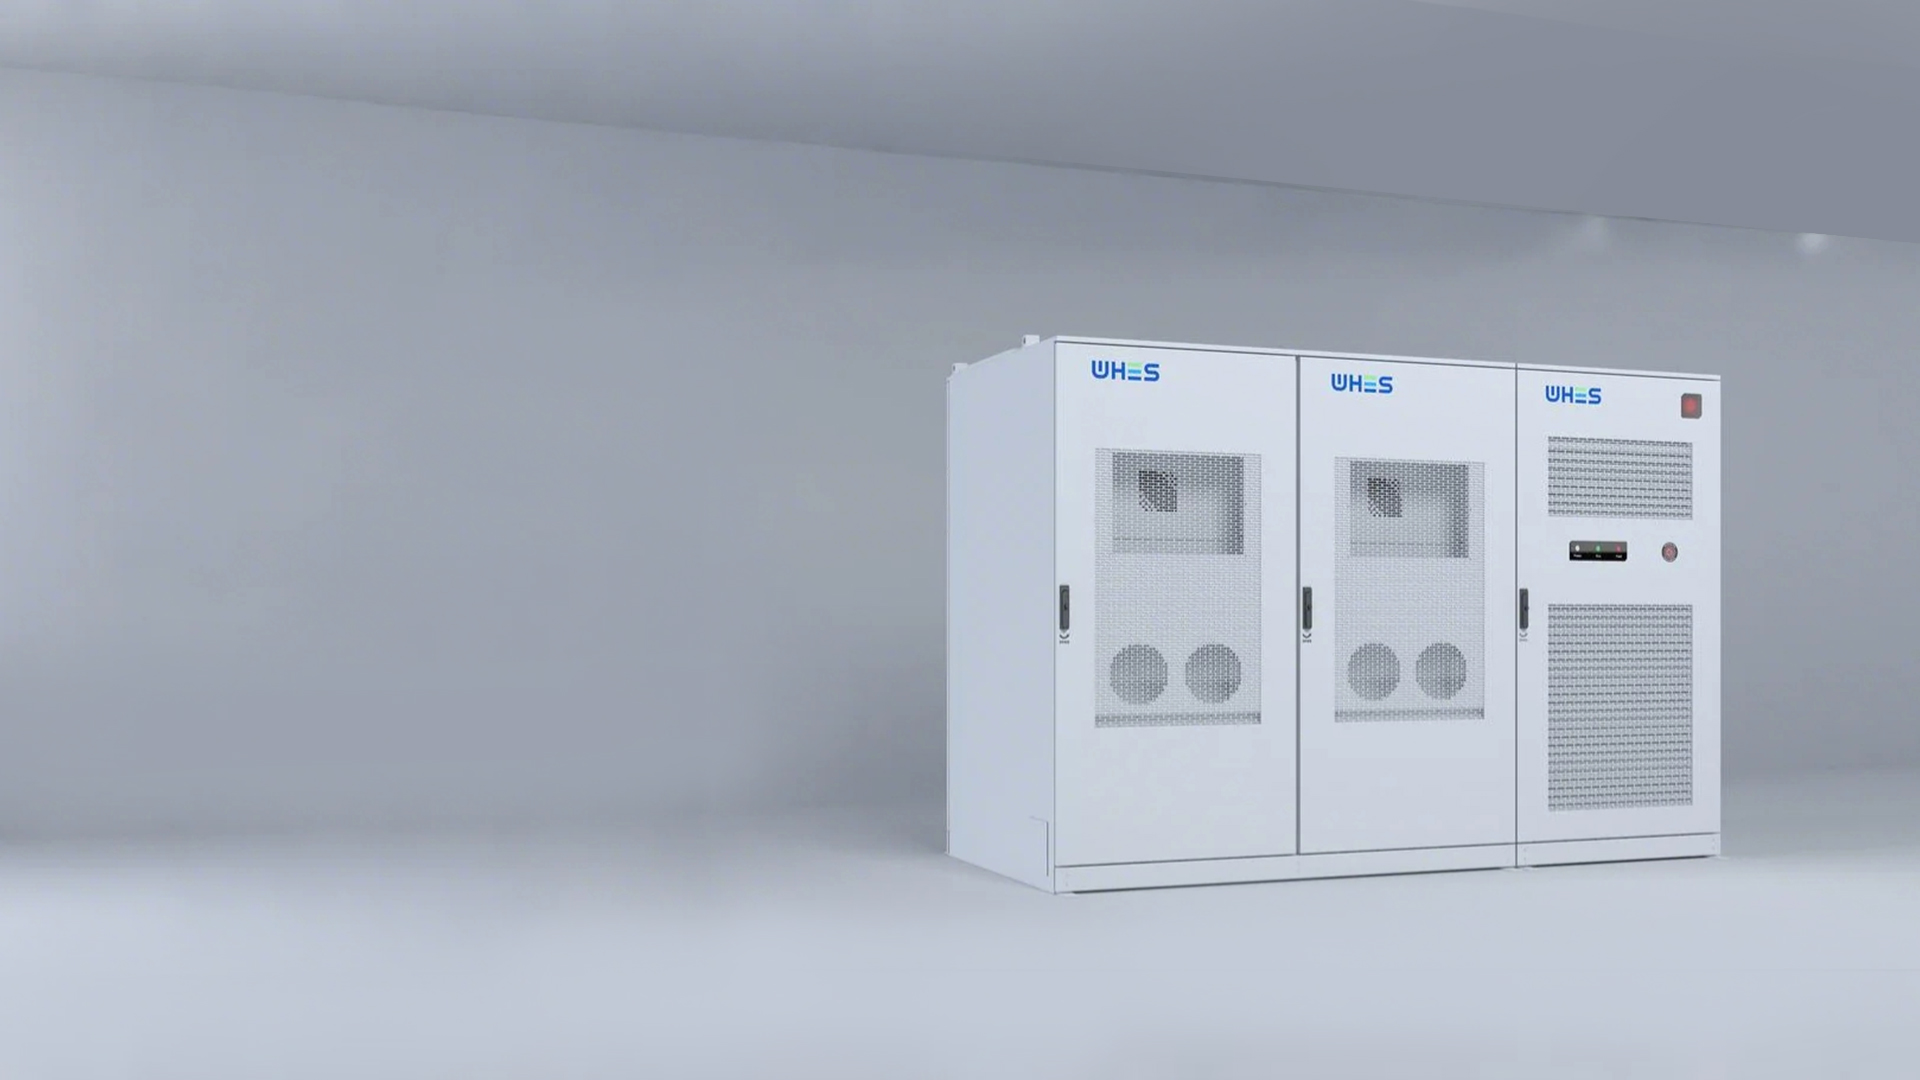
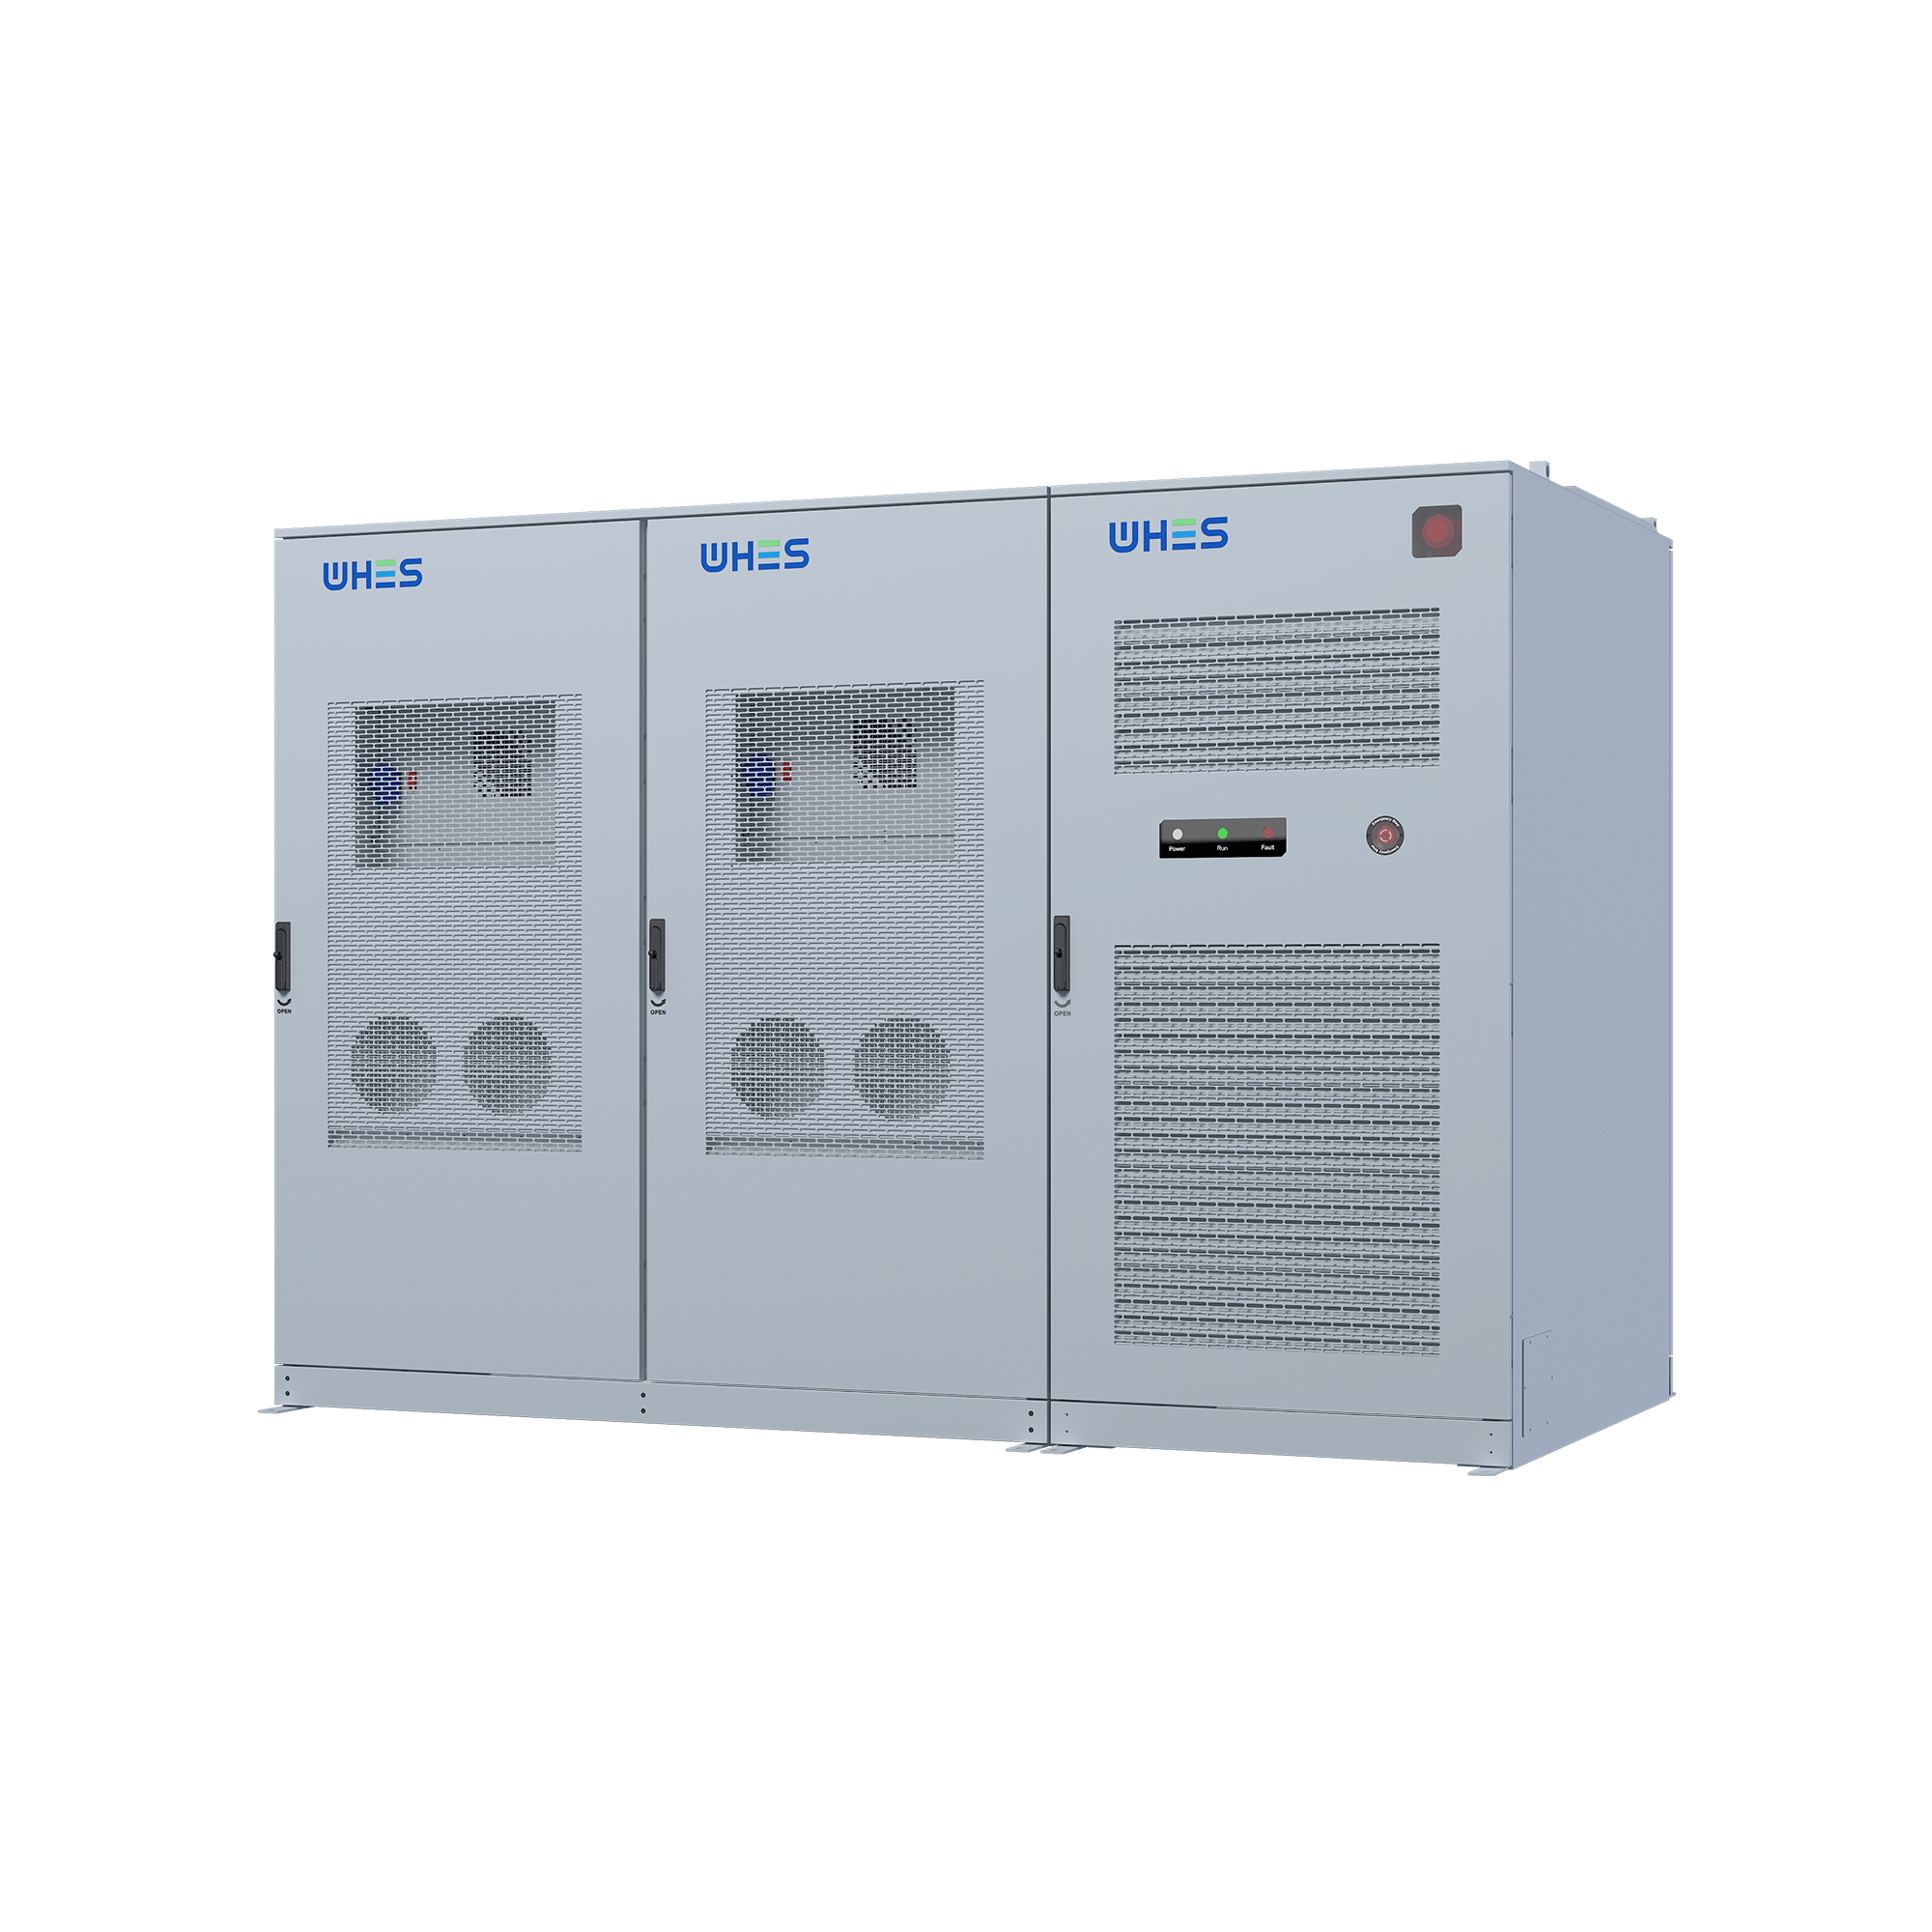
Operational decisions about frequency droop control directly affect grid stability and plant economics when you pair utility‑scale solar with a multi‑megawatt battery. A clear, measured comparison of active power and reactive power compensation rates reveals trade‑offs in response speed, headroom management, and reserve utilization. To ground that comparison practically, consider test deployments such as Hornsdale Power Reserve in South Australia — a widely cited example of battery-enabled frequency response — and recent commercial systems built to serve similar functions. If you’re specifying control logic or procurement requirements, consult the real performance envelope of the hardware rather than idealized curves; product pages such as this commercial energy storage outline inverter and power-module capabilities that set those envelopes.
Droop control fundamentals: active vs reactive
Frequency droop control translates system frequency deviation into a commanded change in active power (P), while voltage droop or reactive droop maps voltage deviation to reactive power (Q). Active power compensation stabilizes system frequency by adjusting charge/discharge power; reactive power compensation supports voltage and reduces regulator stress. Inverters implement these behaviors through control loops inside the power electronics and often expose configurable droop slopes (percent frequency/Hz per percent power). Keep in mind state of charge (SoC) limits and inverter thermal limits — they both bound how much P or Q the ESS can sustainably provide.
How to quantify compensation rates
Measure compensation with three pragmatic metrics: droop slope (the P or Q change per unit of frequency or voltage deviation), response time (ms to seconds for primary action), and sustained capacity (how long the unit can hold the commanded output before SoC or thermal constraints intervene). Instrumented testing should include step- and ramp-response profiles, and notice the interaction with dispatch signals from the energy management system (EMS). During tests, watch for unintended interactions — fast active power injections can momentarily shift voltage, which in turn changes reactive demand and may excite control loops if not coordinated.
Comparing strategies in multi‑MW systems
Two common control strategies appear in practice: decoupled P/Q droop (separate loops for active and reactive) and vector control blending (where P and Q interact through a shared control surface). Decoupled P/Q simplifies predictability but can be conservative on headroom — you reserve separate capacity buffers for P and Q. Vector blending can extract more usable support from the same inverter capacity but requires tighter tuning and high‑quality measurements. Field deployments show that vector approaches often deliver higher utilization in markets that value both fast frequency response and voltage support — yet they demand more from power electronics and protection coordination. For a practical reference on hardware options and inverter ratings, review products like an industrial battery energy storage system to understand continuous vs peak power ratings.
Real‑world anchors and observed outcomes
Hornsdale and similar projects demonstrated that fast battery response materially reduced frequency nadirs during disturbances; operators reported improved stability and market revenues from ancillary services. In North America, grid operators such as CAISO and ERCOT have published high‑level findings that batteries can arrest frequency deviations in seconds — far faster than many thermal units. These operational successes are meaningful but not uniform: outcomes depend on SoC management, forecasting accuracy for PV output, and contractual dispatch obligations. If you design droop around a perfect state of charge you won’t reflect real operations — instead, model worst‑case SoC windows and validate them with live telemetry.
Common implementation pitfalls and mitigations
Engineers often underestimate three failure modes: insufficient headroom allocation, poor coordination between EMS and inverter controllers, and inadequate lab-to-field validation. First, not reserving dynamic headroom for reactive events can force sudden curtailment of active support. Second, conflicting setpoints between a central EMS and local droop loops can create hunting behavior — tune supervisory deadbands to avoid this. Third, skipping full‑scale hardware‑in‑the‑loop tests means you’ll meet surprising thermal or control interactions on commissioning. A practical mitigation strategy: run hardware-in-loop simulations that include real inverter models and realistic PV generation traces — they expose the operational envelope before you commit to firmware settings.
Design trade-offs for solar-plus-storage owners
Decide whether your priority is market revenue (fast frequency products), grid stability (sustained reactive support), or reliable self‑consumption smoothing. If ancillary markets drive revenue, bias toward aggressive active droop with fast response and deeper cycling — but prepare for increased throughput and more frequent battery replacement. If voltage support is the driver, provision additional inverter capacity or adopt dynamic Q allocation that adapts with SoC. In mixed‑objective projects, adaptive droop — which shifts P/Q priorities based on real‑time signals and SoC — often achieves the best net value, though it is operationally more complex.
Three critical evaluation metrics for selecting droop strategies
1) Effective Response Bandwidth: measure the time from disturbance detection to 90% of commanded power response. Faster bandwidth yields better frequency arrest but requires higher quality measurement and control hardware.
2) Usable Energy Headroom: quantify the energy (MWh) available at required power levels for both P and Q events across realistic SoC windows — not just nameplate capacity. This metric predicts how long the system can sustain support during prolonged events.
3) Interaction Robustness Score: assess how the control scheme behaves when exposed to combined P and Q demands, PV ramping, and EMS overrides. Include stress tests for control-loop coupling and protection trip thresholds.
These three golden rules help you select control logic and hardware that deliver predictable, bankable performance in markets and systems alike. In practice, vendors who provide transparent inverter models, verified response curves, and commissioning support shorten the path from design to dependable operation — and that operational value is precisely what WHES brings to large solar‑battery projects. —